A brief introduction to A/B-testing
A/B-testing is a guiding compass for making product decisions. More technically, it’s a method for quantifying the impact of product variations. The process can’t tell us if one variation is unequivocally “better” than another, but it can tell us which of a set of variations is better at producing a certain effect, encouraging a behavior, or achieving a goal.
The basic method is similar to a clinical trial with a placebo group. By testing two or more variations of an experience (labeled A, B, C, etc.) and measuring how they cause similar groups of people to behave differently on average, we can assess a design’s impact. What we need at the minimum, then, is one control (A), one variant (B), and a random sample of users. The two versions could be our product in its current state, and a new idea that we want to compare it against:
At a surface level, A/B testing is as simple as that: build two variations of something and measure the difference in behavior.
Incrementalism and learning
Before we go into the details of running such a test, let’s take a step back and examine the underlying thought process. A philosophy that’s usually coupled with A/B-testing is incrementalism: the idea that we can build great products, make innovative leaps, and overcome daring obstacles by implementing gradual and measurable improvements. A vision can guide this iteration and experimentation, but rather than acting as a blueprint that gets fully built and realized in one humongous project—a risky and expensive endeavor—that vision typically serves as a north star. Small incremental improvements build up and inch us ever closer towards it, but experiments feedback into the vision and slowly transform it over time, placing the north star forever out of reach.
To embrace this philosophy and effectively accumulate insights and improvements through experimentation, we need to foster a culture and process that supports learning. If we don’t, we risk going in circles—running tests that have no impact, and that teach us nothing new. An important goal for a data-driven design organization is not just making an impact but learning as quickly as possible about a moving target. We need to allocate our resources based on how promising our different strategies seem at any given point. What’s worth focusing on will vary over time as your product and audience grows and transforms, and it’s something that you will have to learn and relearn continuously.
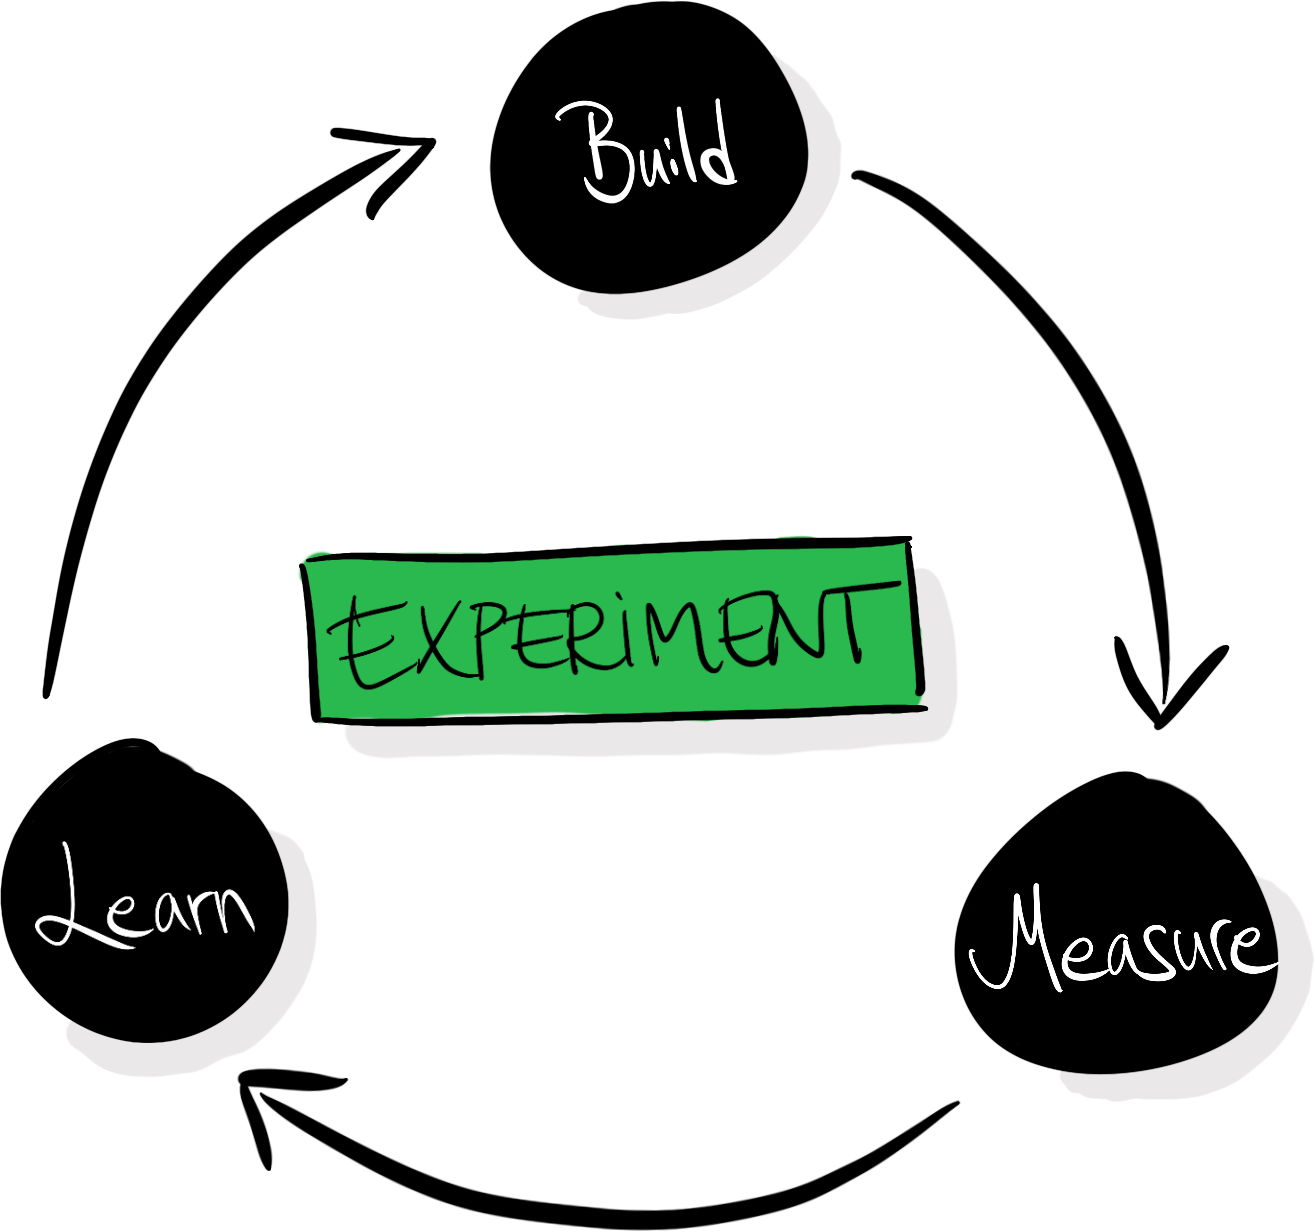
With learning as a core pillar of this philosophy, we can map experiment-driven design as a circular process of building, measuring, and learning:
Every test doesn’t necessarily have to make your product better—but every test should teach you something. The A/B-testing process usually includes the articulation of hypotheses to facilitate that learning: we make sure that we capture our beliefs before running tests so that we can compare them with our new beliefs that we’ve acquired after seeing the results.
At a more granular level, an A/B-testing process can look something like this:
- Ideate: Come up with one or more ideas that you want to test, based on your previous data, experience, problems, and goals.
- Hypothesize: Define hypotheses for each idea, outline why you think those ideas could have an impact, and what result you expect to see.
- Plan: To gaurd against your own biases and what you want to believe, you can tie different outcomes to follow-up actions before running the test. Define an array of outcomes, and tie those outcomes to different follow-up actions.
- Create: Design and implement the variations you believe in most.
- Expose: Ship the variations to a subset of your users in a randomized trial.
- Wait: Wait for the tests to get enough exposure to offer meaningful insights.
- Analyze: Analyze the data from the test.
- Deliberate: Discuss what the results mean and how they validate or disprove your hypotheses.
- Ship, iterate, or abandon: Based on your learnings, roll out a variation to all users, iterate on a direction before running another test, or abandon ideas in favor of exploring other directions.
Running a test
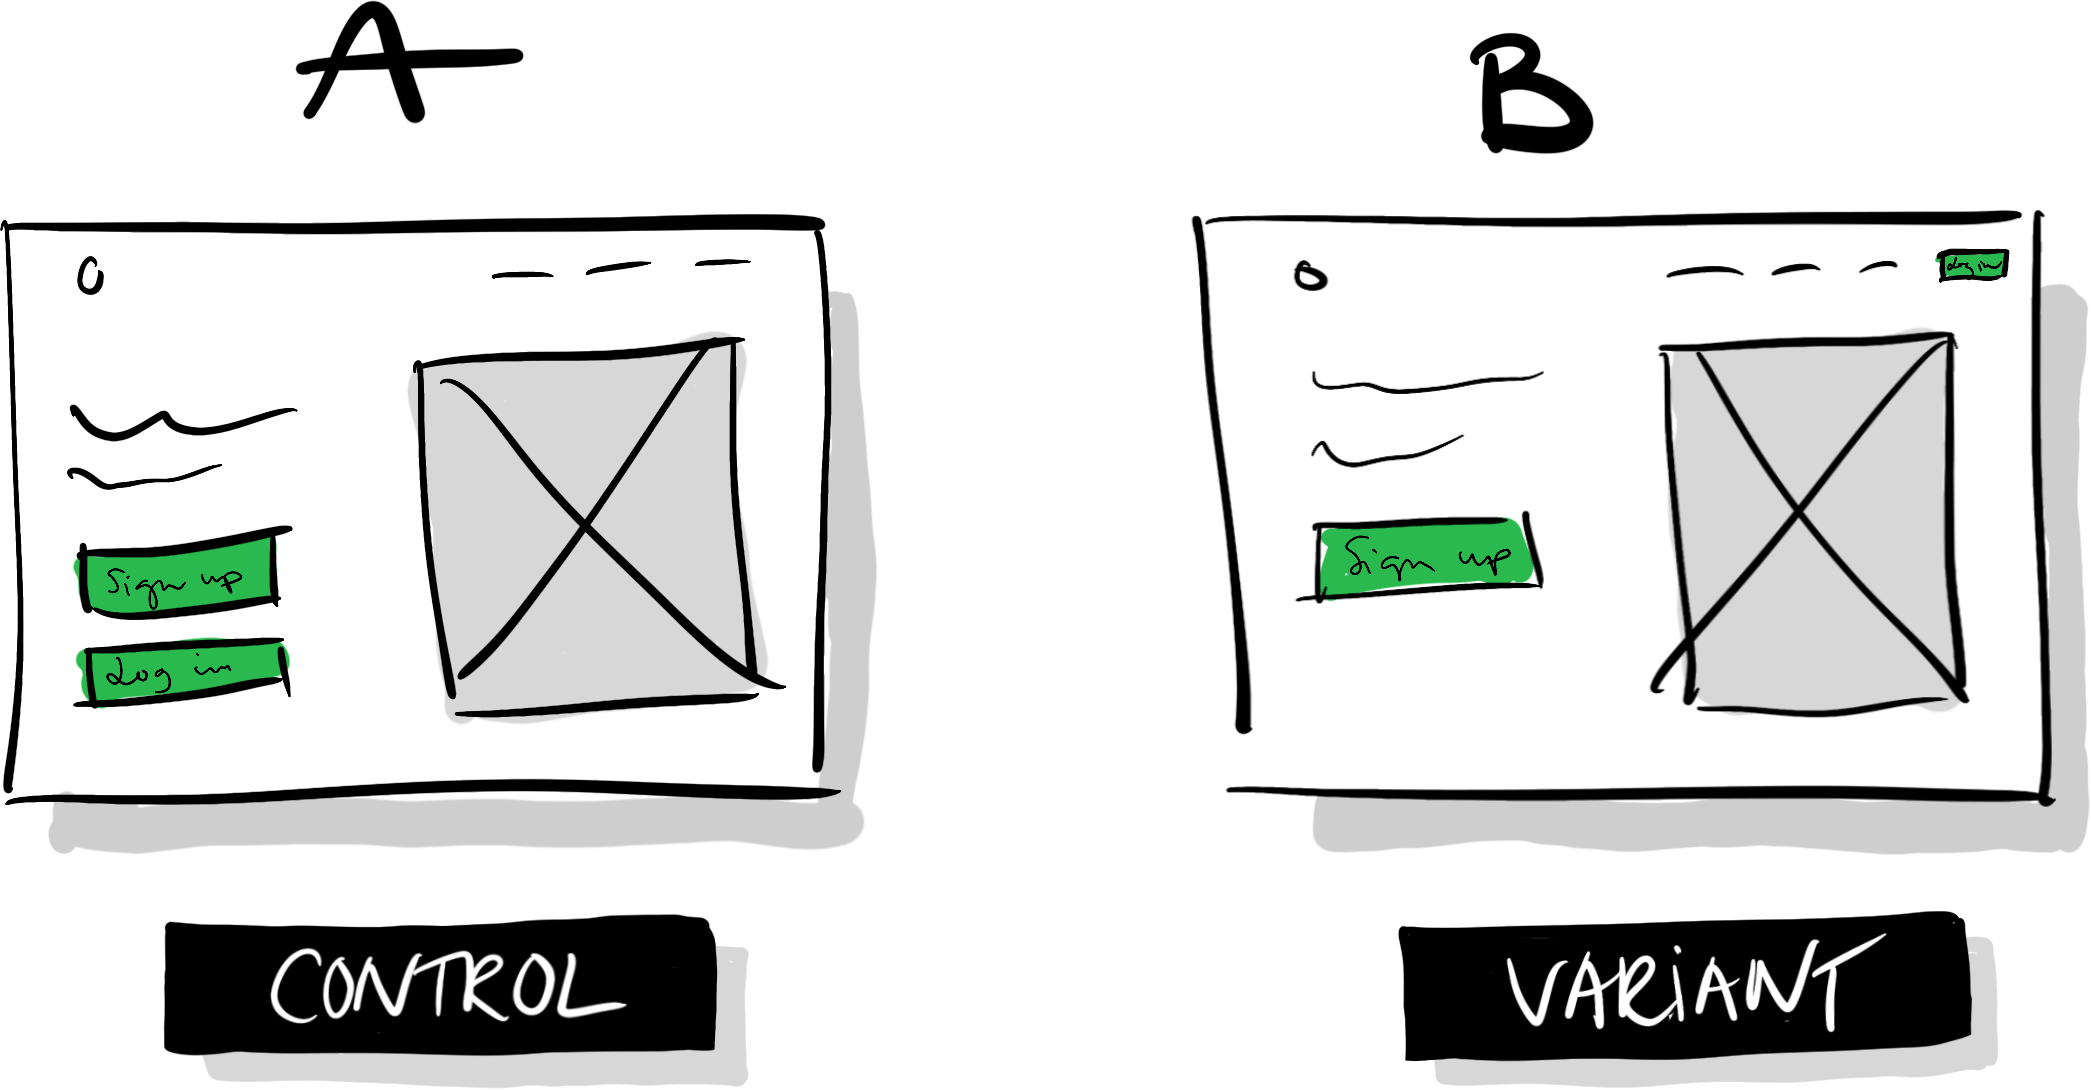
Say that we have a website that looks like illustration A (control) below: we have a logo in the top left, a menu in the top right, an image of our product, a header, and a short description. We then have two large buttons visible above the fold: “Sign up” and “Login.”
Someone in our organization has proposed that we should move the “Login” button to the menu in the top right, and keep the “Sign up” button as is (B). They hypothesize that making the “Sign up” button the most prominent call to action will cause more people to see it, which will lead more people to sign up.
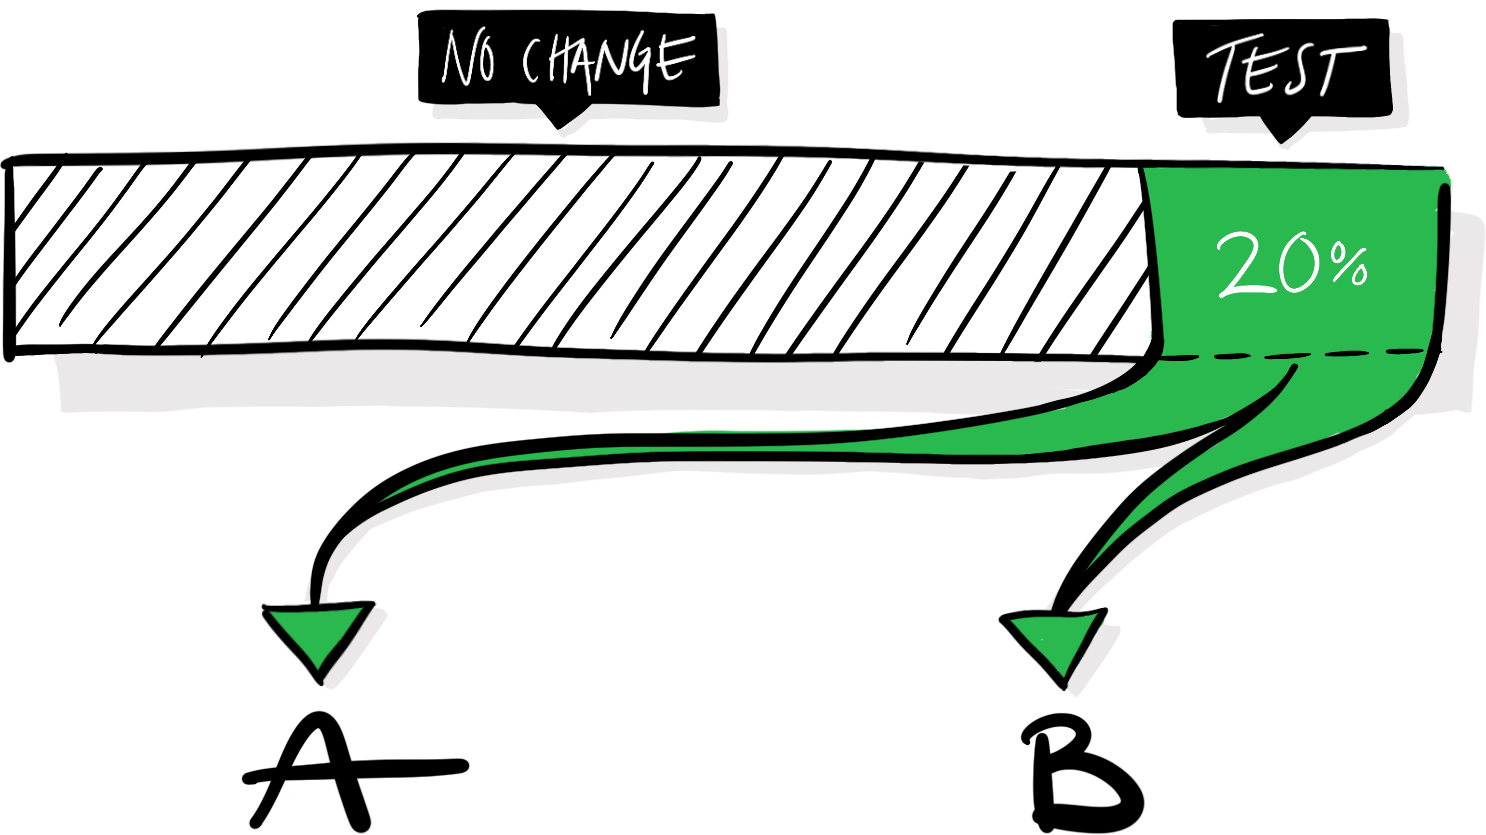
To measure the impact of that change, we need to implement design B and expose a random subset of our users to it, alongside the default experience, which will act as a control. The exact proportion of our visitors (here 20%) that you enroll in a test will vary depending on the test and circumstances. The more users that get enrolled in an experiment the faster you’ll get the data that you need to analyze it, but make sure to not expose more users than necessary. After all, a variation might mistakenly make your product worse, and you want to mitigate any potential negative effects. In our hypothetical scenario, half of the visitors assigned to the test will see variation A, and half of them will see variation B.
The experiences are identical in every single aspect except the moved “Login” button. If we see that people using the B-version of our website are more likely to sign up, we can conclude that the altered button causes that effect.
In other words, we can establish a causational relationship between design B and a behavioral change: an increase in sign-ups. Not just a correlation—this is why we need a control group to compare against. If we implement B, launch it to all our users, and then notice an increase in sign-ups, that increase would only correlate with the launch of the new design—it could as well be caused by a random tweet, a holiday, or a mention in a podcast. We wouldn’t know for sure, so we wouldn’t be able to draw any conclusions about the effects of the new design.
We also need the users to be randomly assigned to each cell to infer a causal relationship. If we select users for the cells by different criteria and end up with more engaged users in one of the groups, it might make that cell perform better regardless of the introduced change: the skewed selection of users is already more engaged on average. If we randomize the distribution of users, we can expect that all attributes (engagement, age, experience, etc.) are equally distributed between the groups, and won’t influence the outcome.
You become what you measure
Presume that we run this test, and after analyzing it, we see a statistically significant four percentage-point increase in sign-ups for variation B:
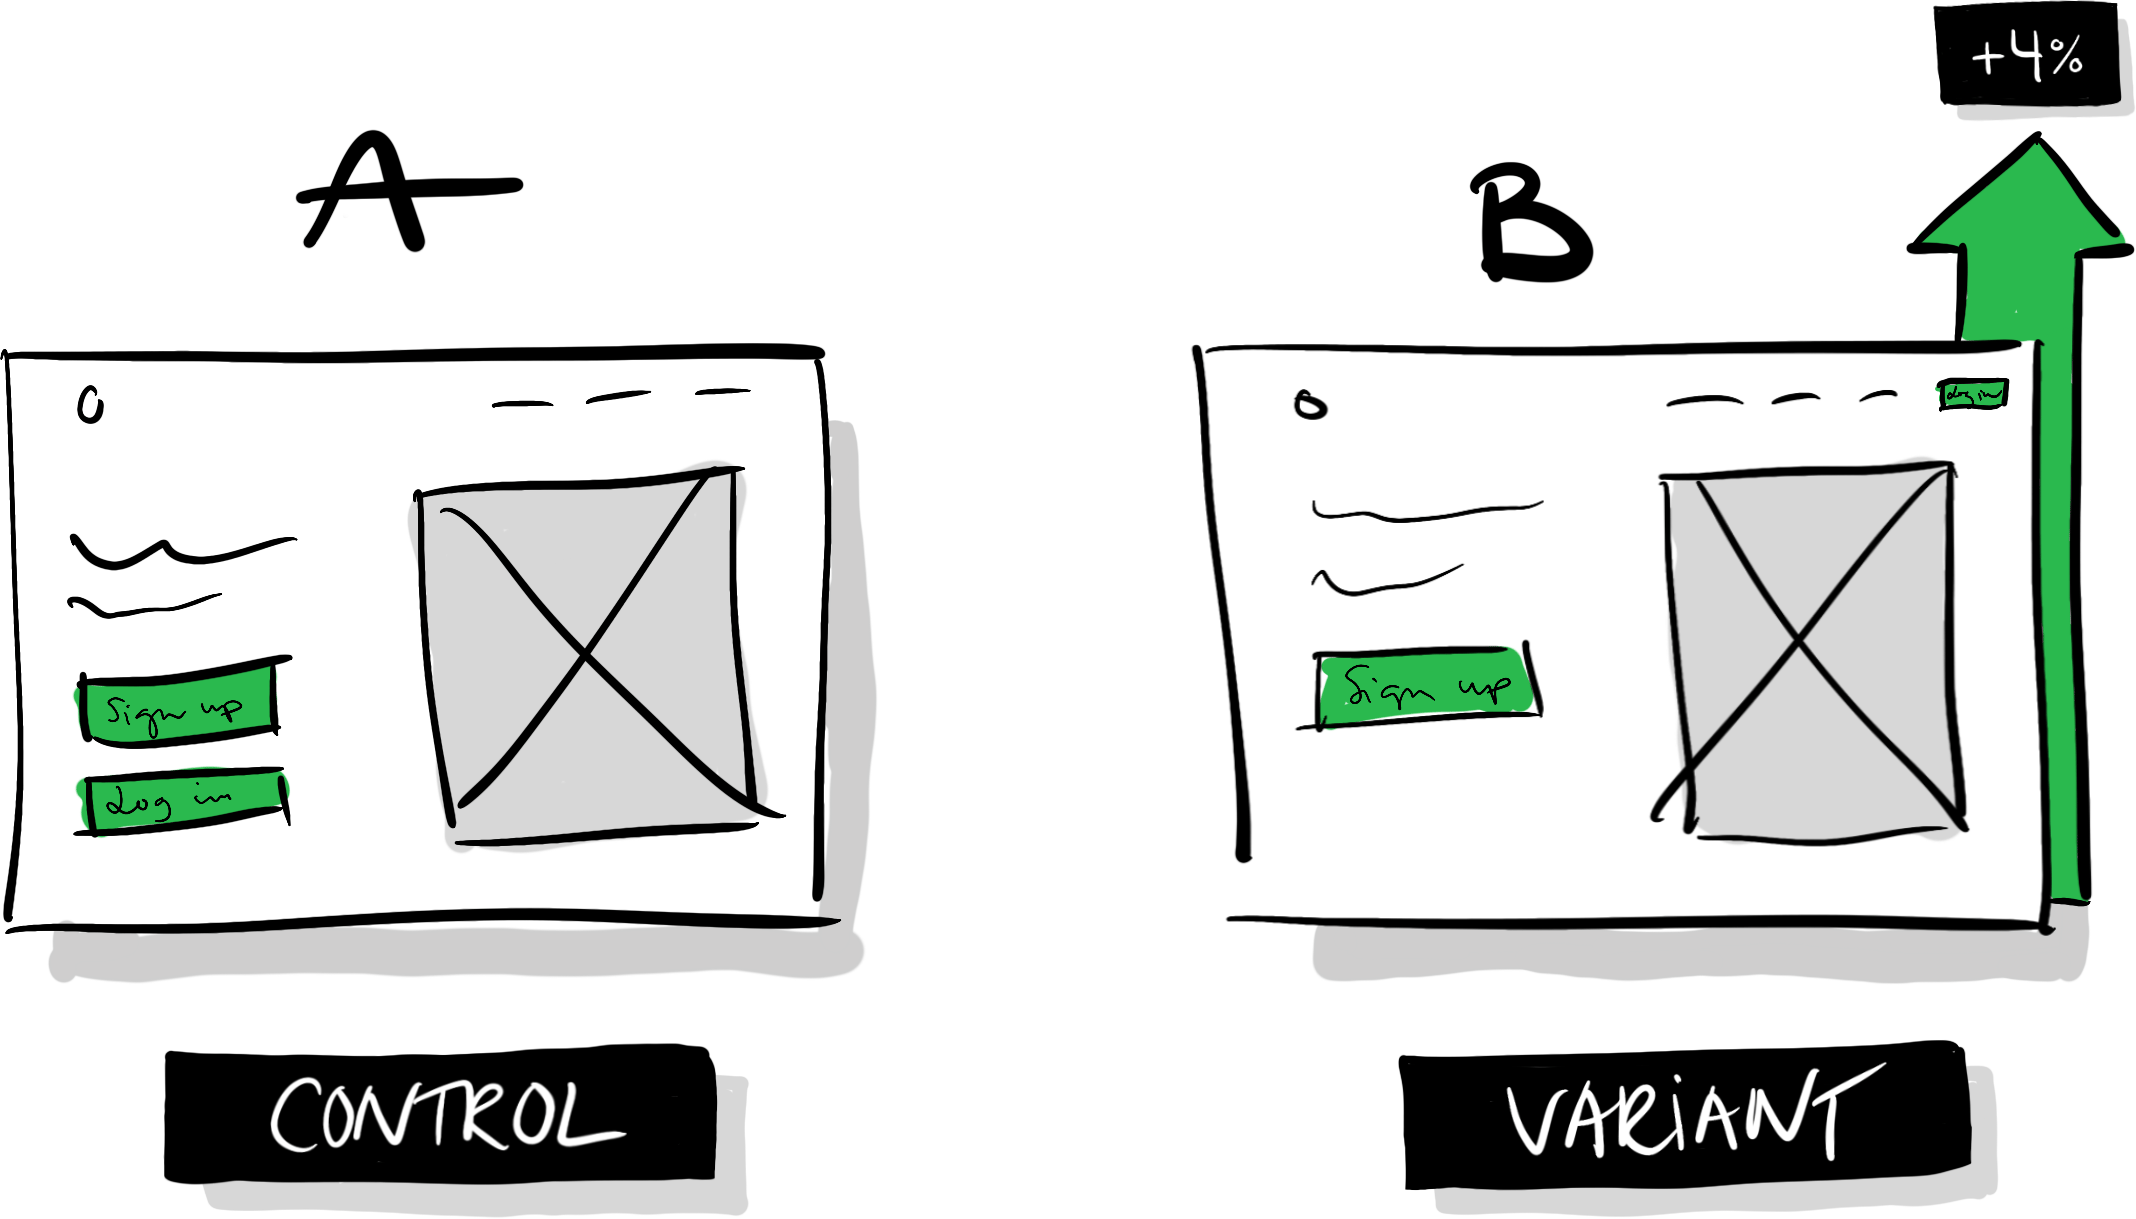
Variation B looks like a clear winner! Should we launch it? Here’s where we need to return to the notion that an A/B-test can’t tell us if B is unequivocally better than A. If our team’s goal is to increase sign-ups and we only measure sign-ups to assess if our tests are successful or not, we’ll likely run precisely these kinds of tests, where we promote the one feature connected to our goal while neglecting or diminishing other features. In this instance, the result can be a slow but steady accumulation of changes that taken together go against common sense: we’ll make it increasingly difficult for already signed up users to access the product.
If the only thing we measure is the metric that’s fundamental for our success, we have a destructive setup that will enforce skewed incentives to promote features connected to our goal while neglecting other parts of the experience. If other teams in the same organization have similarly skewed incentives, it’s a recipe for conflicts and counterproductive back-and-forths.
Unless we keep track of other key metrics and keep an eye out for accidental changes in different behaviors, we risk accumulating a myriad of unwanted side effects. When running the test outlined in this example, we might need to measure successful logins and retention (returning users over a certain period) in addition to sign-ups to understand if the change is introducing friction for already signed up users.
In other words, the goals you set up and the key metrics that you keep track of will undoubtedly influence your product decisions. They form the restrictions that you iterate within.
Balancing impact vs. learnings
Why are we spending so much time on analyzing the effects of such a tiny difference? Wouldn’t it be more worthwhile to test more drastic changes? We could, without a doubt, introduce more ambitious and more significant changes. The challenge is that the more we change in one single test, the more difficult it can be to understand the results of that test—to pull it apart and learn precisely what variable caused which behavioral change.
On the flip side, if we don’t change enough, we might fail to produce any meaningful changes at all, or at least not impactful enough to be noticeable. If we focus on learning and incremental improvements, then, there’s a U-shaped relationship between how much we change in a test, and how much we can typically learn from it:
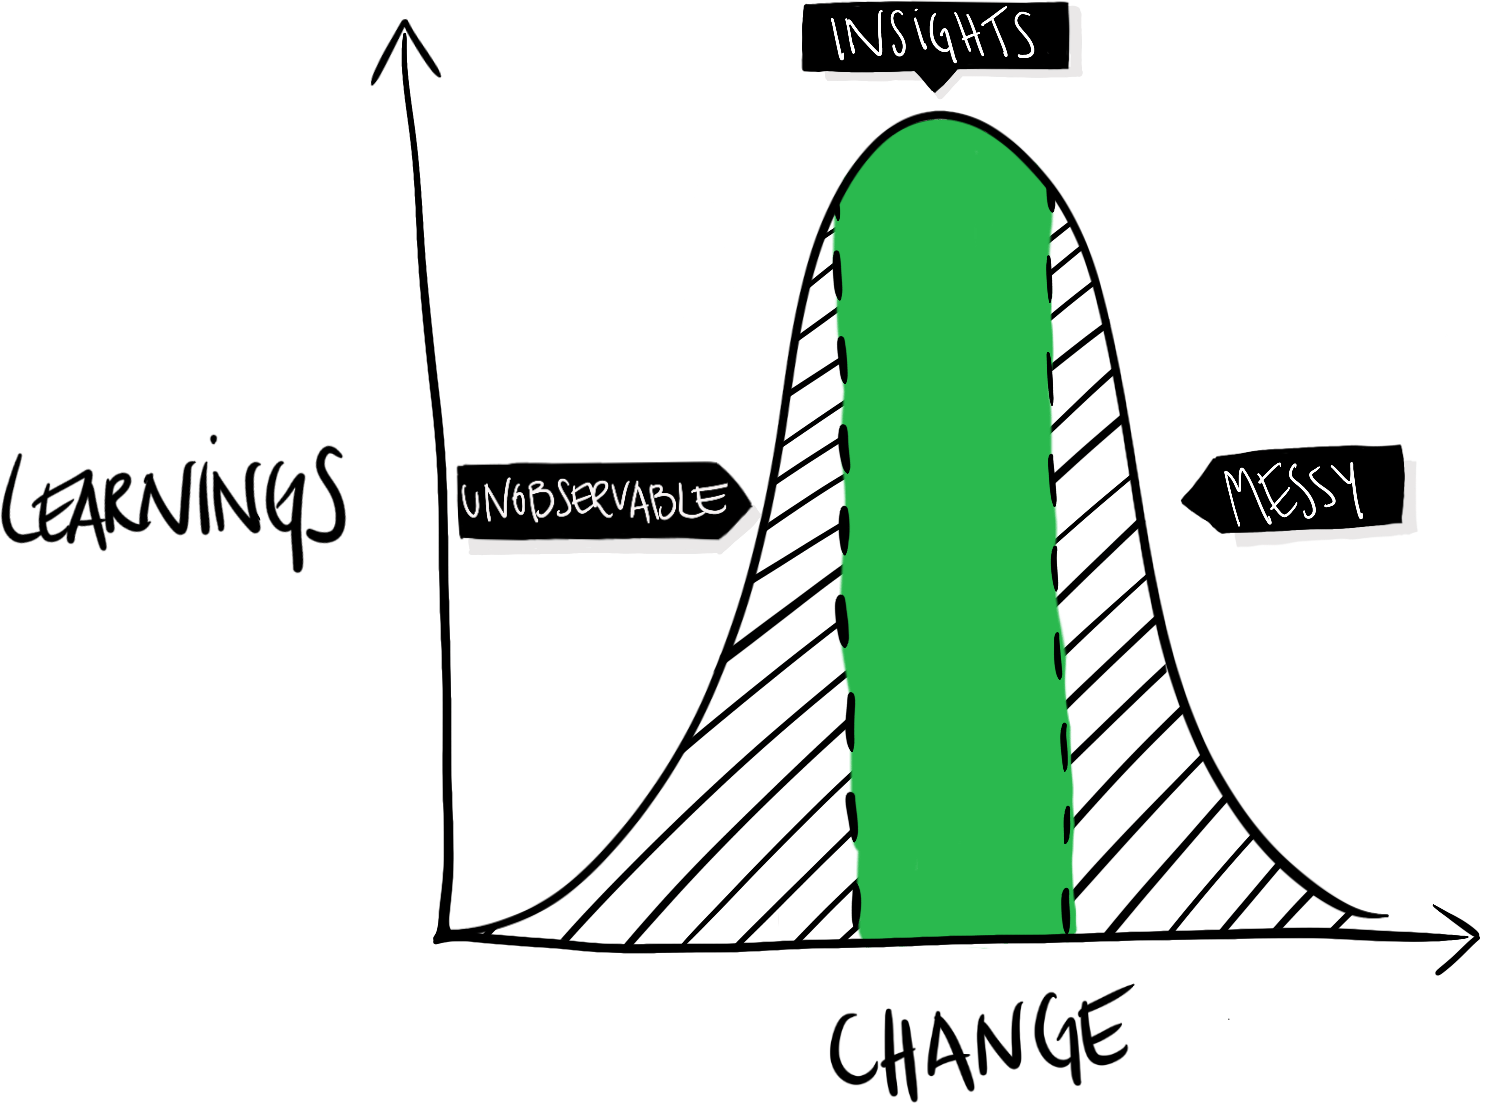
If we don’t change enough, the impact will be too small to be noticeable. The difference will be unobservable or negligible. If we change too much—e.g., completely redesign the entire product—the introduced changes and the produced outcomes can become a tangled mess. We’ve no idea what variable that caused what effect. Clear and valuable insights are somewhere in the middle. Developing a sense of how significant changes to test is part of learning how to utilize A/B-tests effectively. It’s different from product to product and depends on how well-optimized your product already is.
Importantly, this doesn’t mean that you shouldn’t test more significant and visionary changes or ideas—it just means that every test is a gamble, and the bigger the change, the higher the risk of blurring learnings. At the same time, an ambitious change might hit the jackpot and make a substantial and meaningful impact.
A defense against regressions
This process might seem to be a terribly expensive way of improving a product, and to be fair, it is. We’re spending a lot of time conducting tests that we could’ve spent building and shipping new features. So, why is it worth it? Or rather, when? As a rule of thumb, the more users you have, the more damage you can cause by shipping features that, despite your best intentions, happen to make the product worse for your average user.
The A/B-testing process really shines when it’s more expensive to make mistakes than to control for them. As your user base grows and your product matures, A/B-testing and data-driven design become an increasingly valuable tool not only to learn and iterate but to defend yourself against regressions. We can use it to gate the innovation process and only launch changes that we know make the product better—we introduce an objective selection process that only lets the fittest ideas survive. An overly zealous application of that selection process might shut out any change which’s effects aren’t quantifiable (which isn’t great—everything that matters isn’t quantifiable), but done right it can democratize the creative process and create an experimentation platform with clear goals and restrictions that we can iterate within.